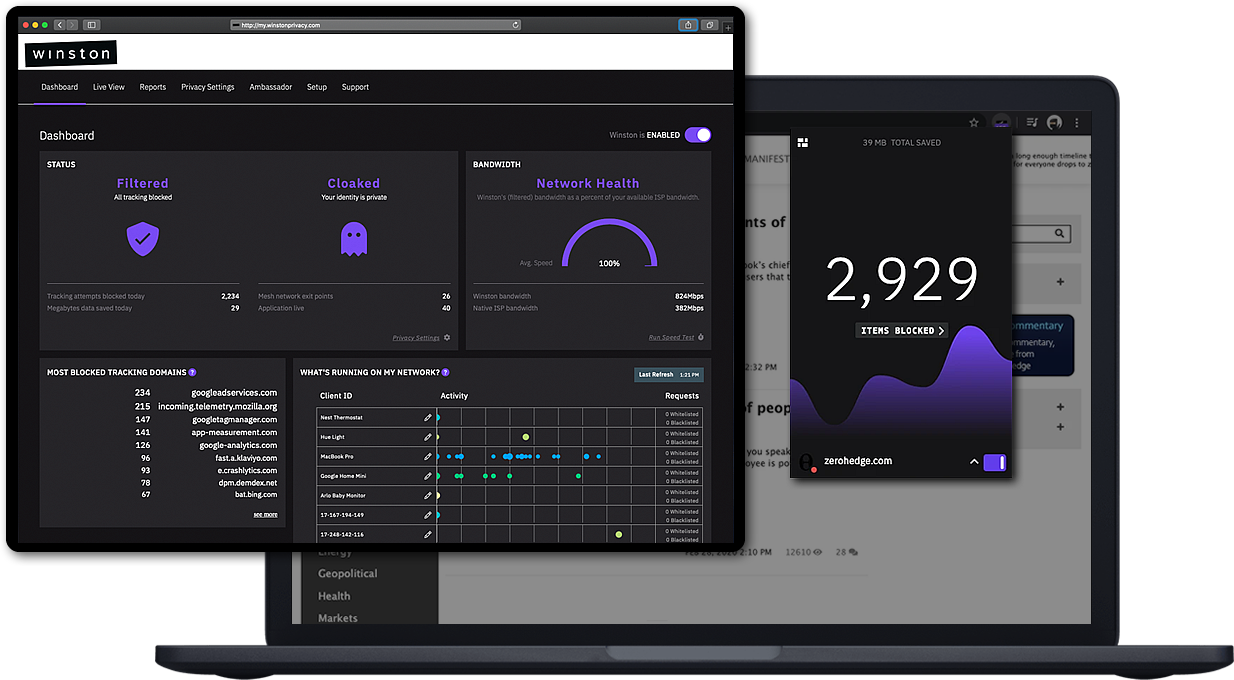
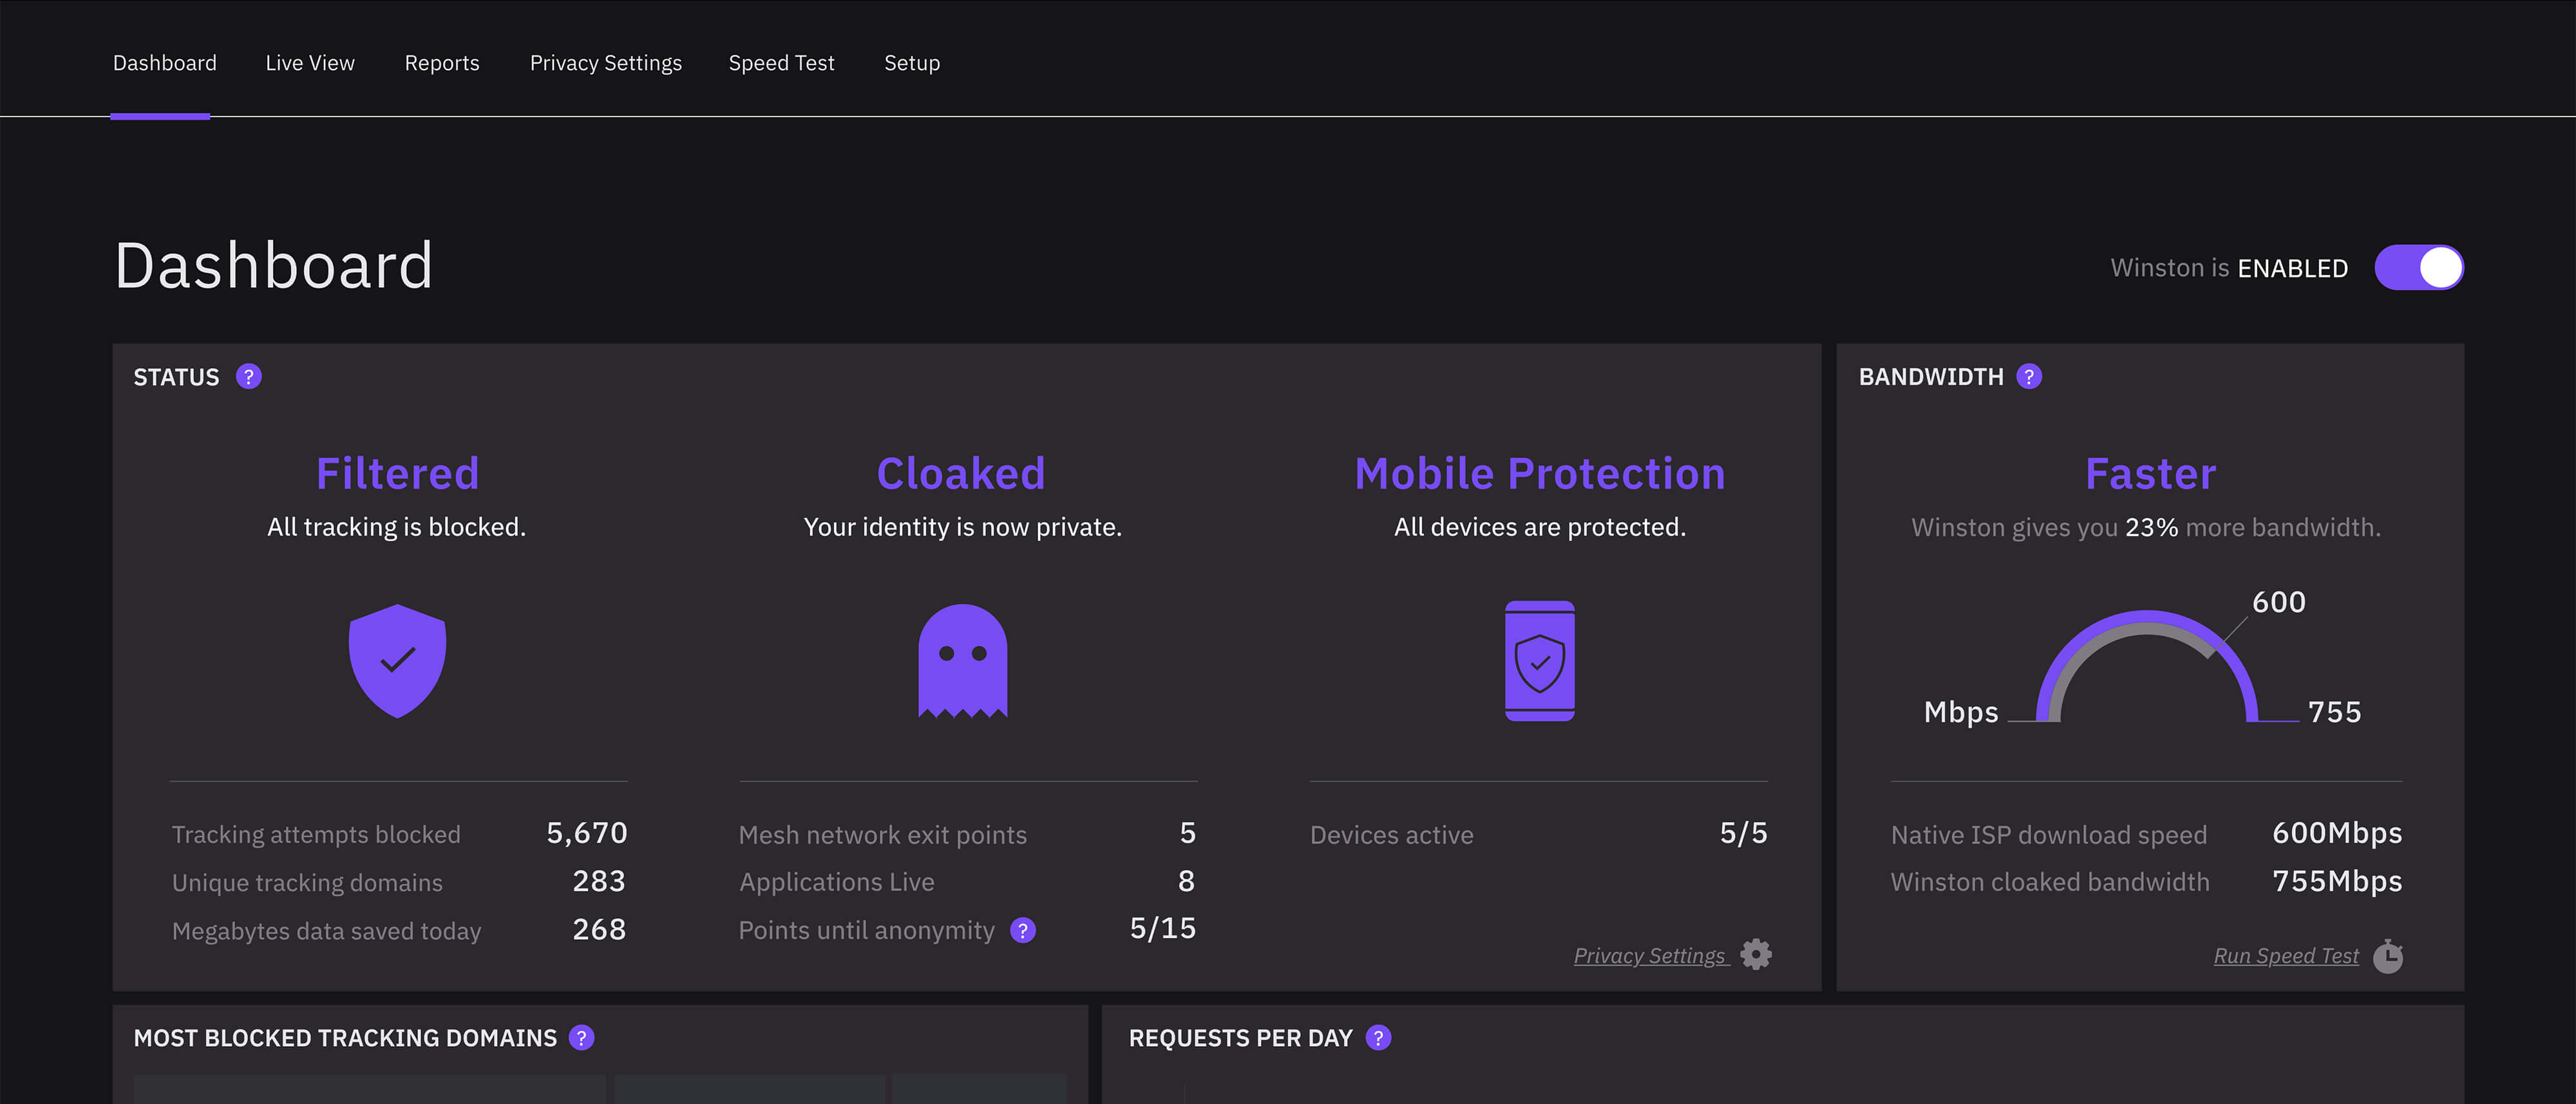
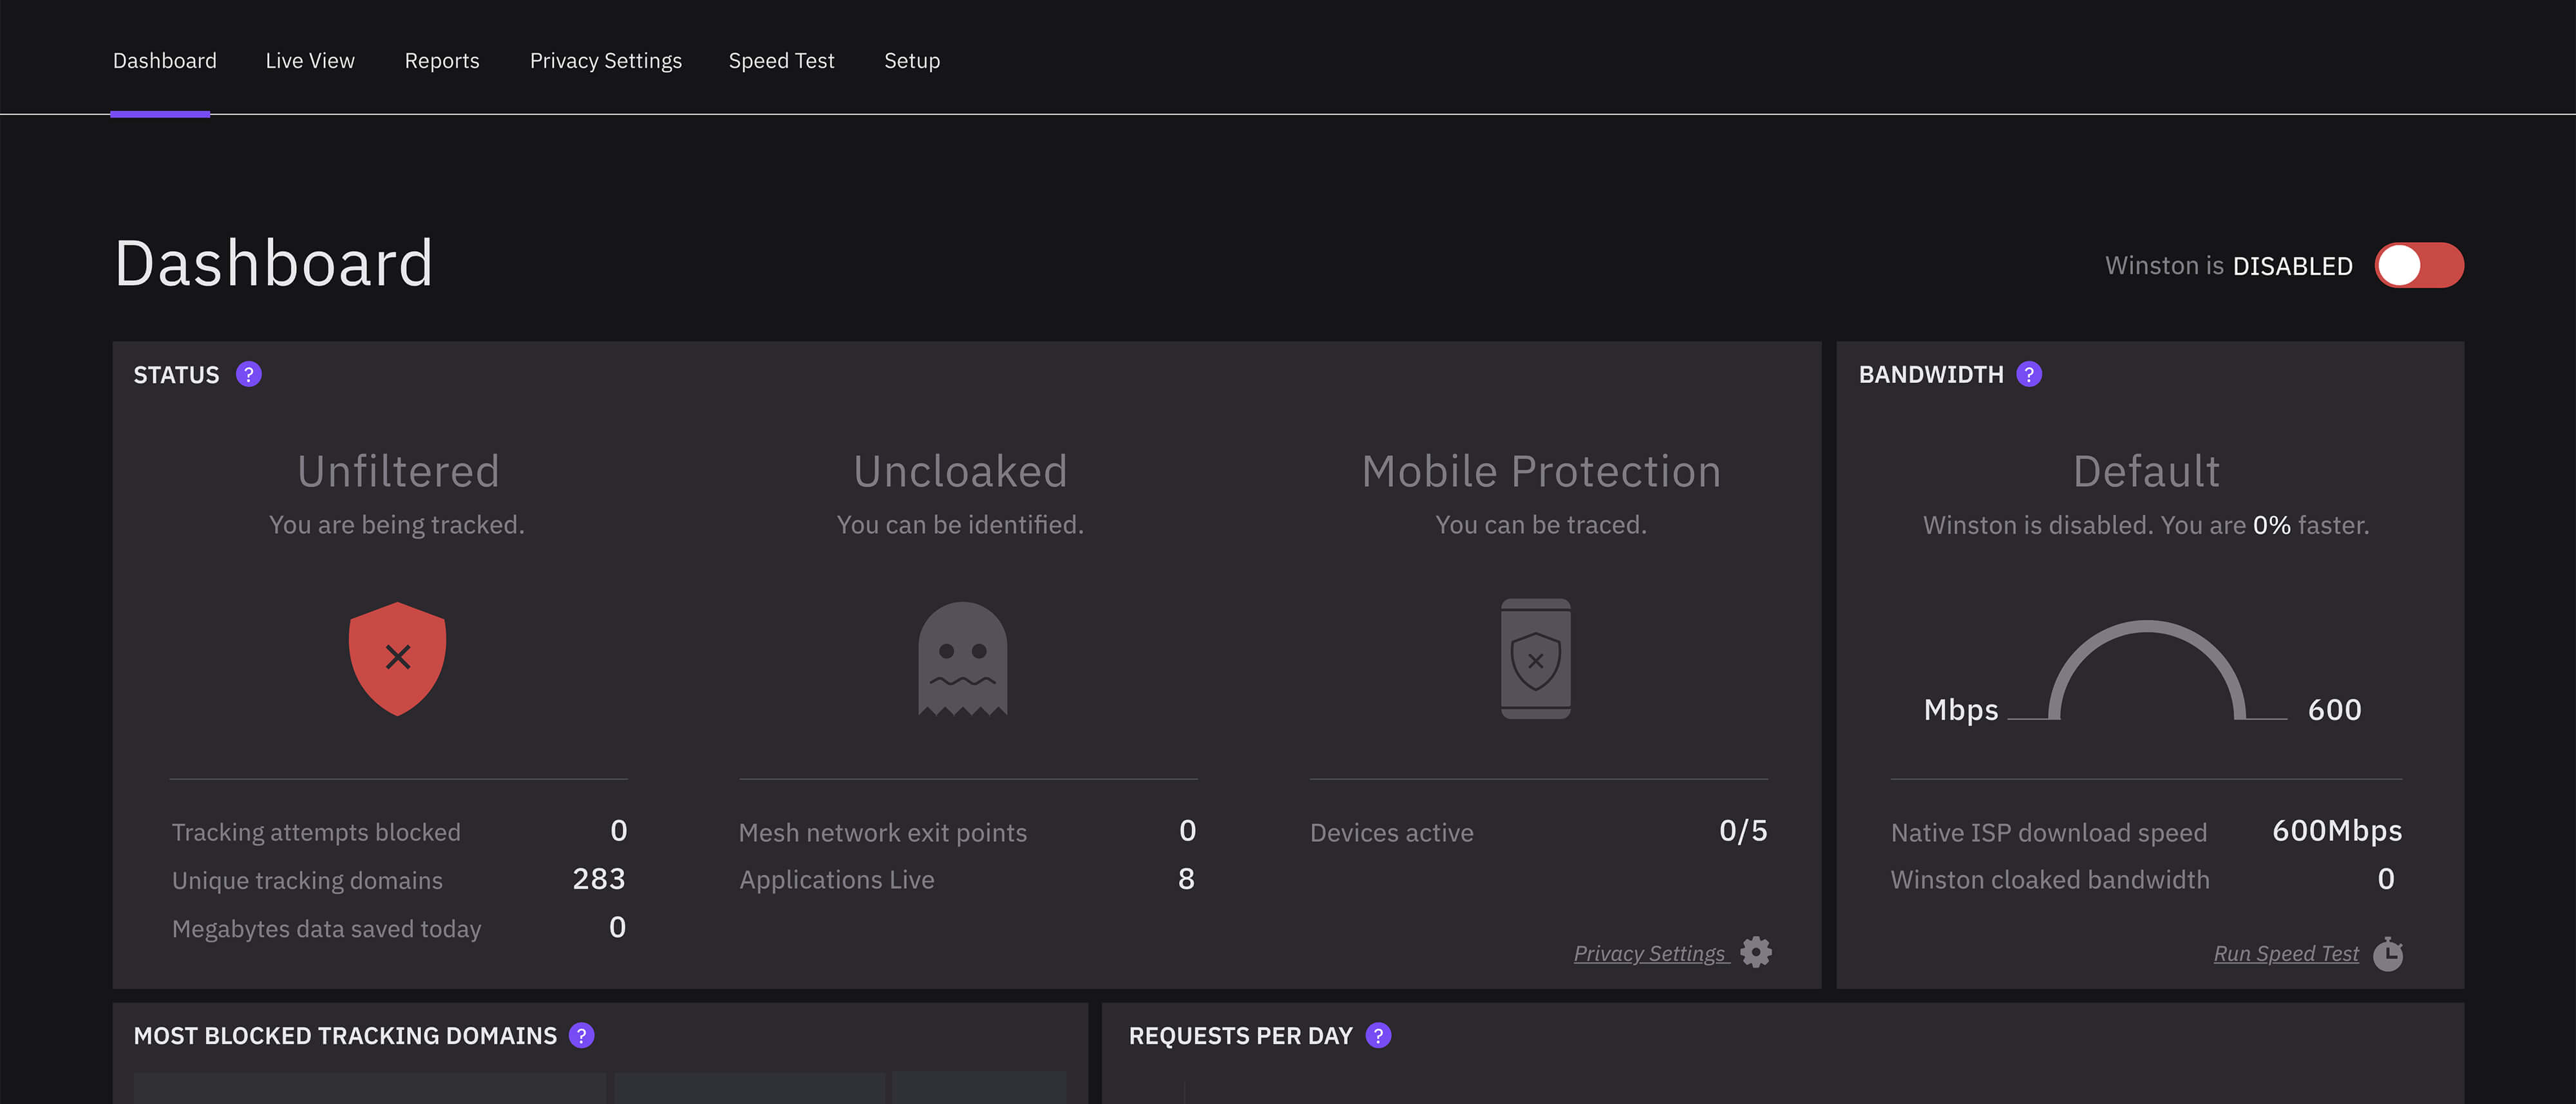
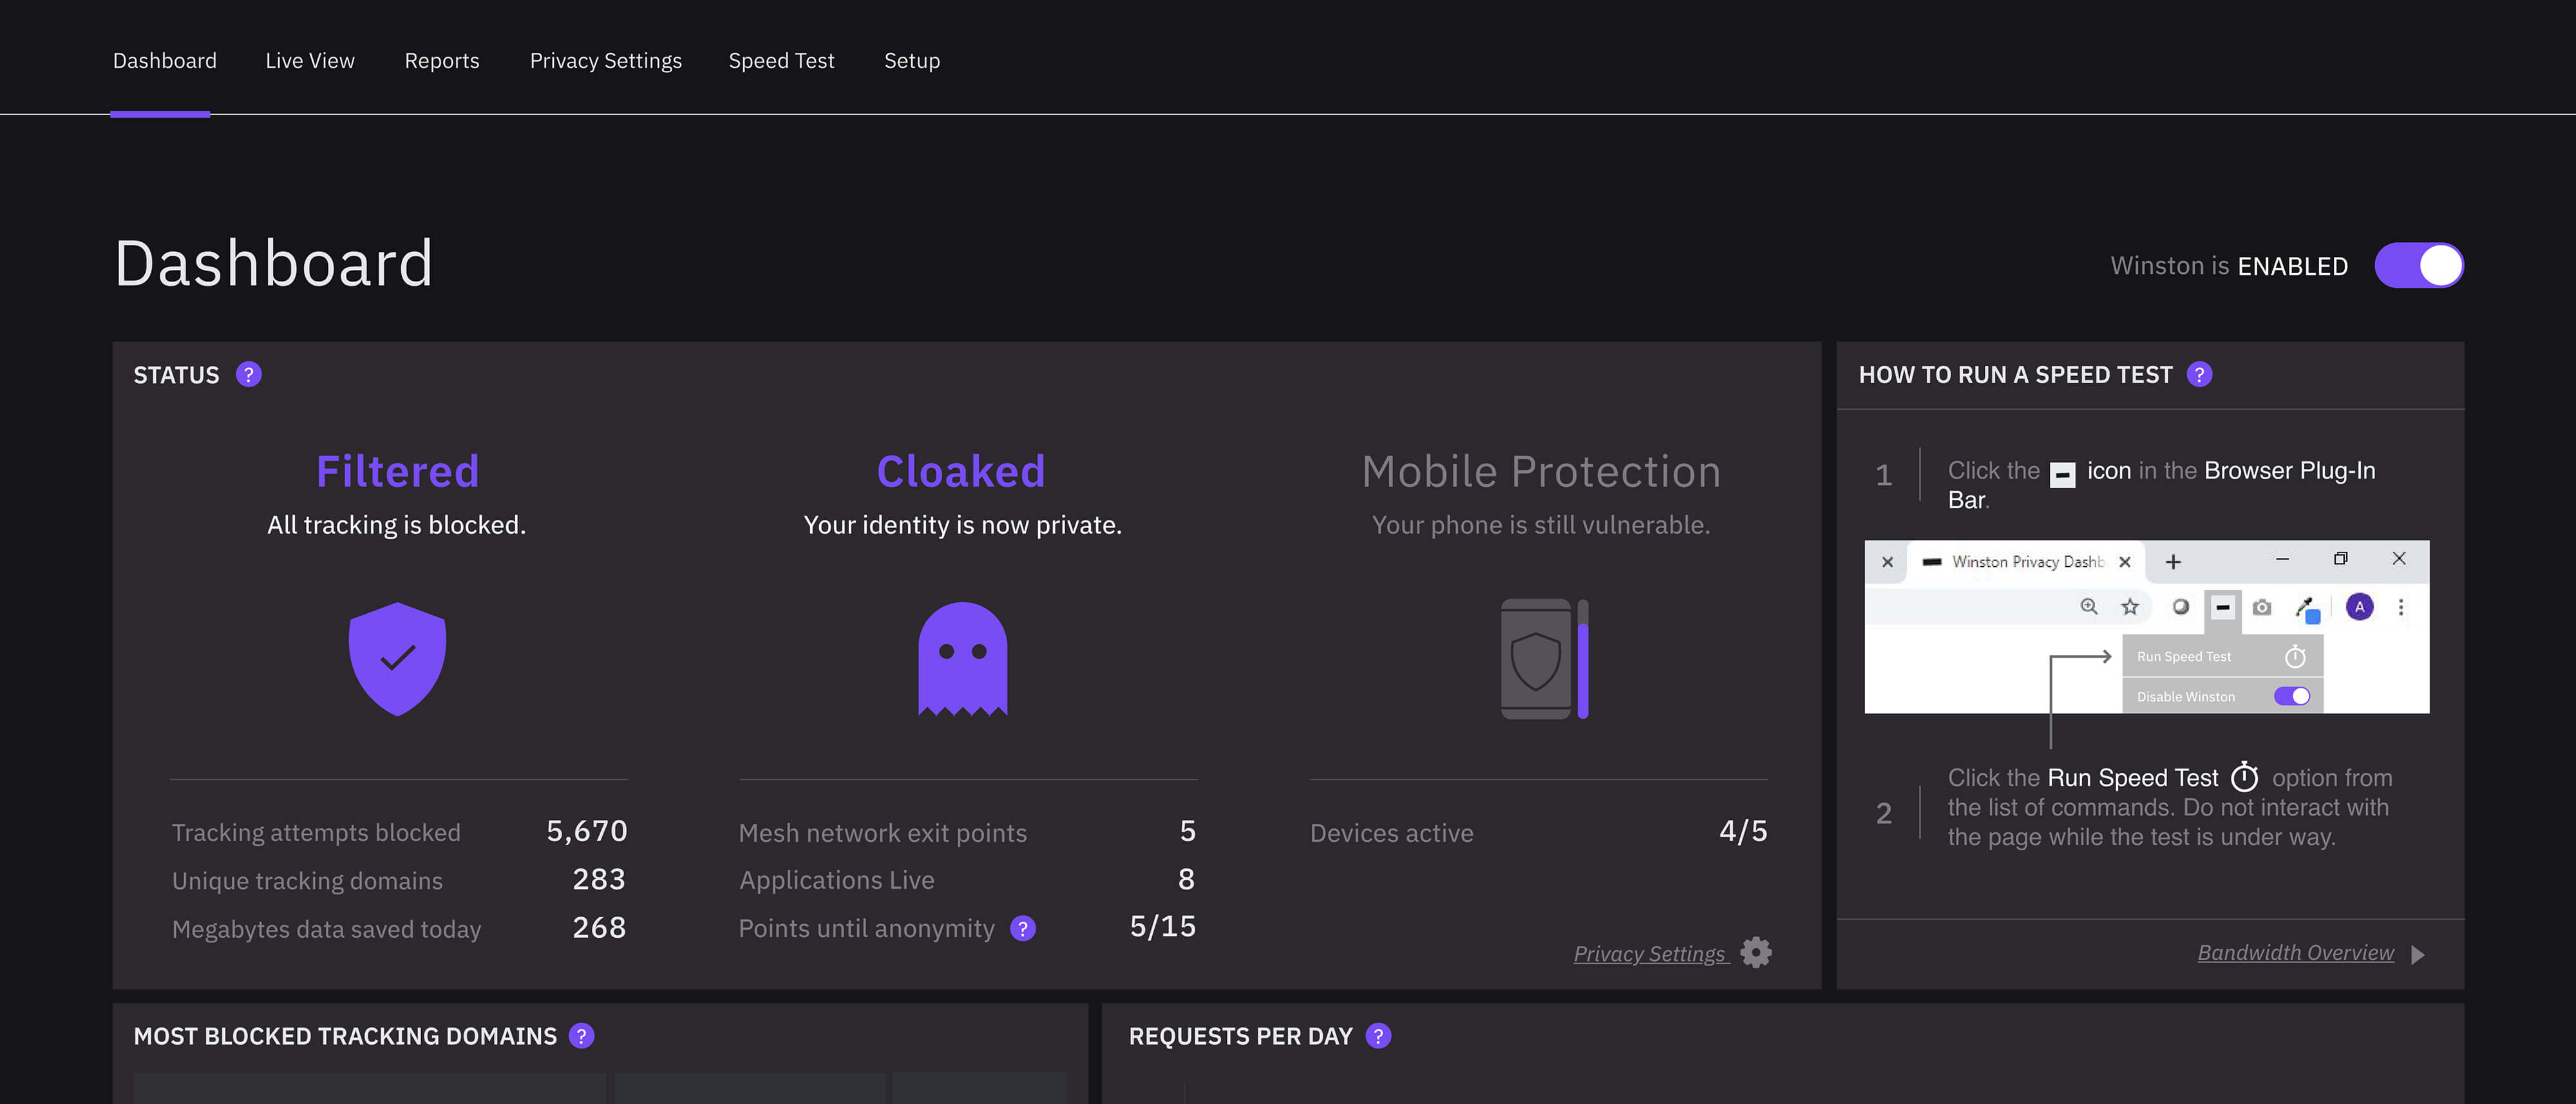
The interface below was commissioned by Winston founder Richard Stokes for their product's online dashboard. The speed graph compares different webpage load speeds, with and without the Winston filtering the results. Color is used sparingly to highlight key items, such as tracking requests (orange) and filtered speeds (purple). The graph shows all data generated within the test period, stacking each URL request and its individual load time in the Y axis and their progress in seconds across the X axis. Additional data is located upper left, while information about individual URLs pops up when it is hovered over.
Role: I designed and illustrated the speed test infographic with guidance from Chris Watson, MNML's chief strategist. I also developed the status dashboard, building on brand and design work done by fellow MNML designers Sean Nelson and Zeeshan Hakkim.